

For consulting foresters, landowners, utilities and land trusts
Fly it, or run it yourself.
We can fly a tract and deliver the inventory, or you can run the Silvalytics app on your own data. Either way, diameter and volume are estimates you can calibrate to your plots. Outputs are GIS layers, rasters and a QGIS project.
Services and software
Four ways to work with us.
-
Survey and inventory service
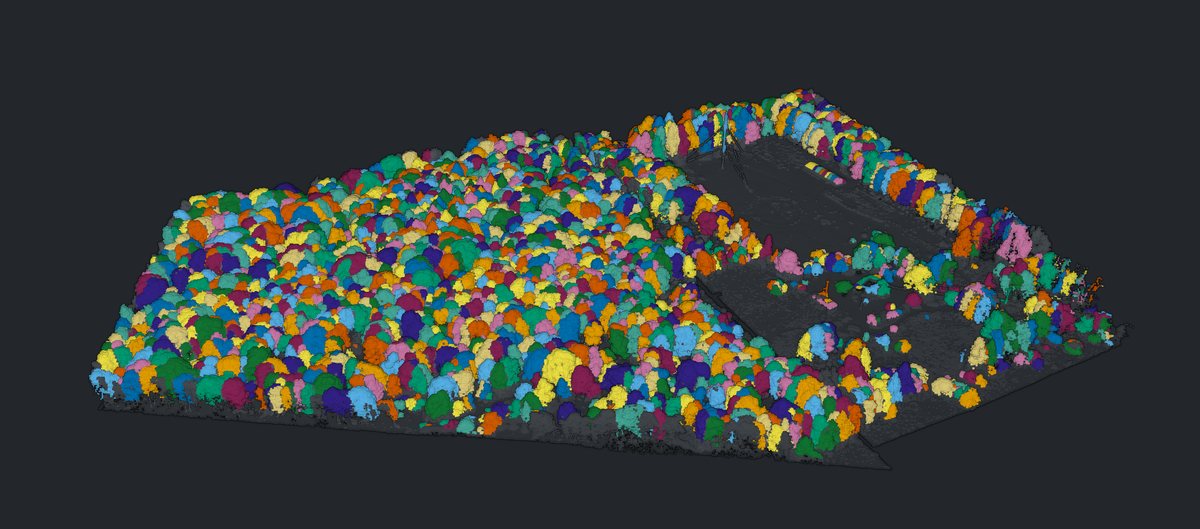
We fly the tract with LiDAR and multispectral sensors, processes it in the Silvalytics app and delivers the tree-by-tree inventory, maps, 3D model and reports. Scope is set by acreage and access.
Request a quote -
Software
The Silvalytics desktop app for Windows, version 2.19, for foresters and survey firms who fly their own data. No published pricing.
Request a trial or demo -
Field calibration
A tallied-plot visit with RTK-located trees to calibrate the diameter and species models on your tract.
Book a field calibration -
Infrastructure clearance
Power-line and building reach assessment for utilities and corridor owners. On one 6.6-acre power-line test plot (Flux), the software detected one line, two spans, six wires and a 184 ft (56 m) tower in 140 seconds.
Ask about corridor work
In development, not yet available
- Hosted processing with a web viewer
- Drone and sensor kits
- Field kits: RTK GNSS, rugged tablet, field app
Deliverables
What you get back.
Files you keep. Layers and rasters open in QGIS or other GIS software, and tables open in a spreadsheet.
- Tree-by-tree table: number, position, height, crown diameter, estimated DBH and volume
- GIS layers for crowns and stems
- Rasters: canopy height, terrain, hillshade, contours, hydrology, canopy cover and gaps
- A QGIS project
- Classified LAS with tree IDs
- CSV and XLSX tables, including per-acre stand tables and size classes
- Reports: forestry, carbon (with uncertainty), ecology, canopy
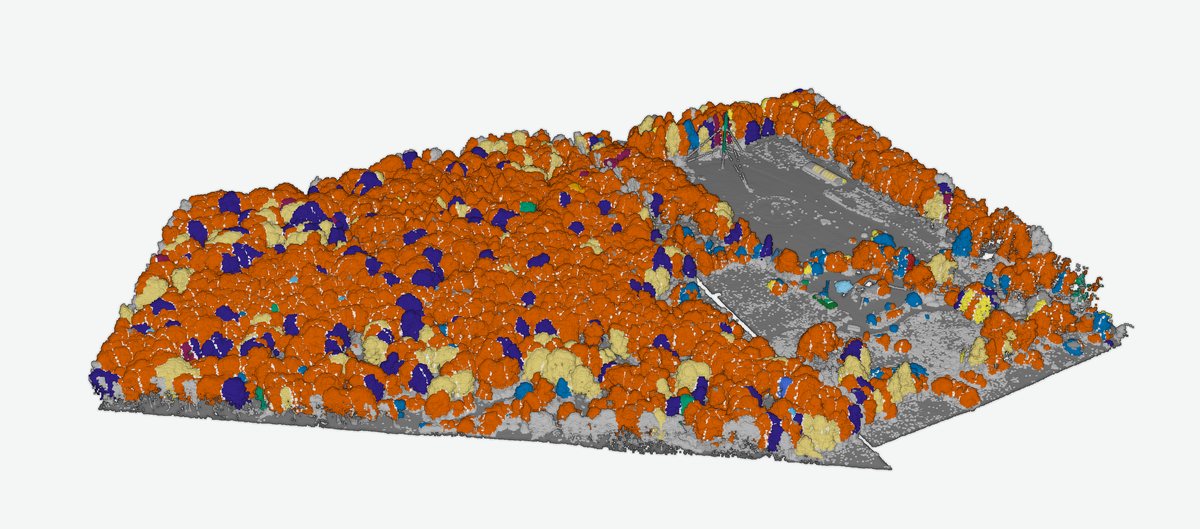
- Species map with a status on every call (experimental)
- Plant-ID from orthomosaics (tiled)
- Imagery-vs-LiDAR reconciliation
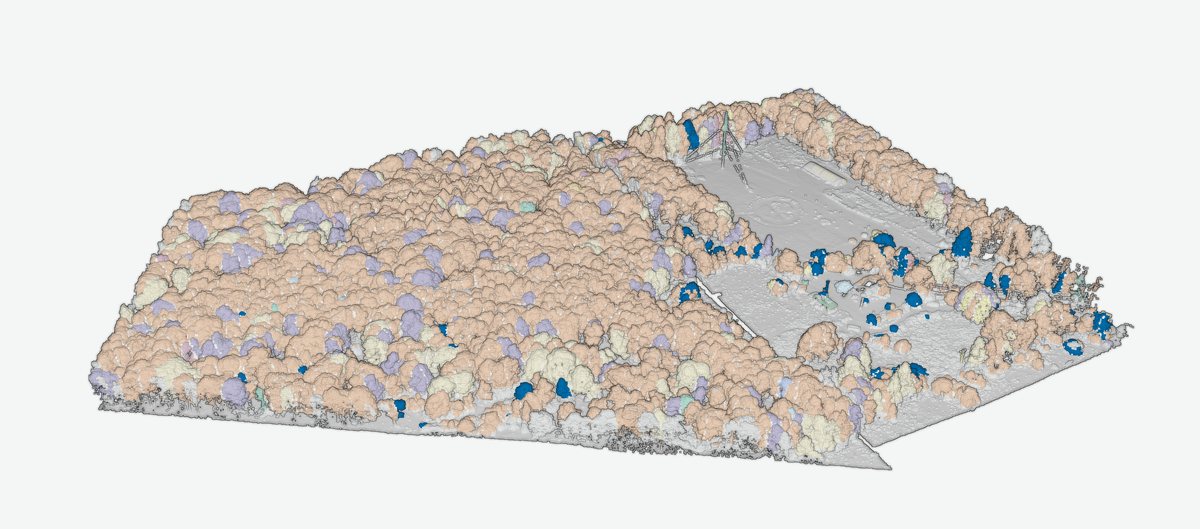
- A 3D model the owner can open
Before we fly
What a survey needs from you.
- Tract boundary
- A map or outline of the area to be surveyed, sent with your request.
- Access
- Permission to be on the tract, including for any plot visit.
- Airspace
- The tract has to be flyable. Mention any known restrictions in your message.
- Leaf-on flight for species
- If species matters, the flight should be leaf-on.
- Optional field plots
- A plot tally with RTK positions lets us calibrate diameter and species for your tract. Without it you still get a position, height and crown diameter on every tree.
Cruise and flight
Where the cruise still wins, where the flight wins, and how they fit.
Foresters typically target about plus or minus 10% sampling error at 90 to 95% confidence (Oregon Dept. of Forestry sample-size method; BC cruising manual). Silvalytics Solutions does not sample. It measures every visible tree and uses your plots to calibrate.
| Aspect | Timber cruise | Silvalytics Solutions | Together |
|---|---|---|---|
| What is measured | A sample of trees on fixed-radius, prism, strip or 3P plots; 100% tally for small sales | Every visible tree, from the air | Plots become calibration, not expansion |
| Coverage | Expanded from the sample to the stand | Every visible tree | Every visible tree, calibrated to the plots |
| Tree positions | Plot locations, not every tree | A position for every tree | A position for every tree |
| Height | Measured on sample trees | LiDAR on every tree | LiDAR on every tree |
| DBH | Direct, with a tape | Model estimate, calibrated to your plots | Tape on plots trains the model. On one Benton Hollow plot, held-out DBH RMSE fell from 9.3 in to 7.2 in |
| Species | Certain | Experimental, with a status on every call | Field-verified on plots, estimated elsewhere. On one Benton Hollow plot, the calibrated fit got 15 of 24 held-out trees right (62.5%, against 50% from always guessing the majority species) |
| Grade and defect | Assessed by the cruiser | Not measured | From the cruise |
| Understory and suppressed trees | Included | Understory points are flagged, not tied to a tree | From the cruise |
| Infrastructure clearance | Not part of a cruise | Power lines, towers and buildings detected, with tree-to-structure reach measured in 3D; shown on one 6.6-acre test plot (Flux) | From the flight |
| Speed and repeatability | On foot; repeat by re-cruising | Benton Hollow (28.3 acres) processed in 182 seconds on a laptop after the flight. Repeat by re-flying | Re-fly, re-run |
| Acceptance in appraisal and legal work | Established | Not established | The cruise remains the record where required |
| Deliverable | Stand table and report | GIS layers, rasters, classified LAS, tables, reports and a 3D model the owner can open | Both |
| Cost | Priced per acre by plot intensity, terrain and season (Missouri Extension; public forum quotes) | Quoted by acreage and access; no published price | Request a quote |
Not yet built: hosted or web processing, and tree identity across repeat surveys. Species is experimental, and its accuracy has not been proven across sites. Tracts over about 100 million points need a large-memory workstation (a 172 million-point tract needs about 32 GB today).
Benton Hollow, one tallied plot, held-out numbers
What one tallied plot did for the models.
These are held-out results after calibrating settings and refitting on a single plot of the same 28.3-acre tract. They are one tract's numbers, not a guarantee.
| Metric | Before | After |
|---|---|---|
| Crown detection vs field tally, F-score | 0.36 | 0.73 (0.78 crowns per field tree) |
| DBH RMSE | 9.3 in (23.5 cm) | 7.2 in (18.3 cm) |
| DBH bias | +4.7 in | -0.4 in |
| DBH median error | 5.3 in | 2.4 in |
| Species (experimental), held-out trees correct | 0 of 24 (generic model) | 15 of 24 (62.5%),against 50% from always guessing the majority species |
DBH is a calibrated estimate, not a tape measurement.
Version 2.19
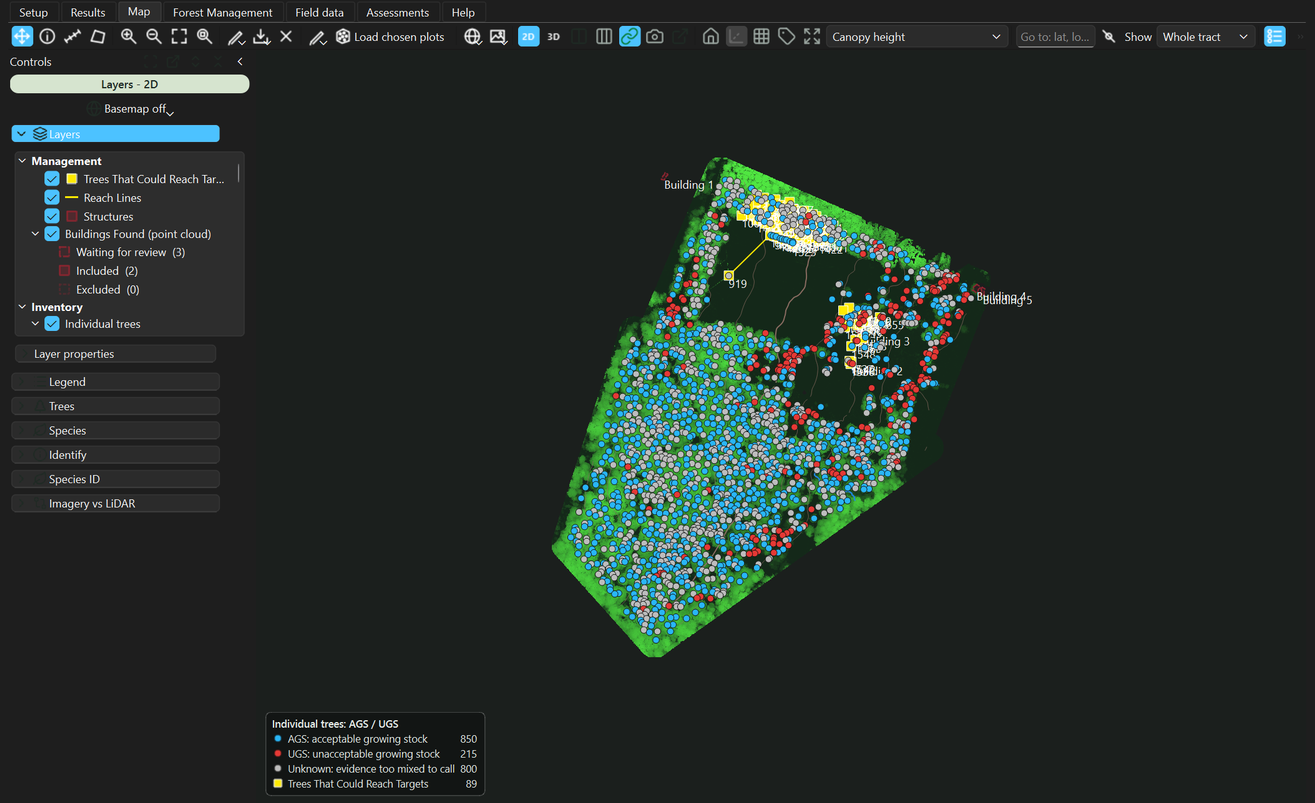
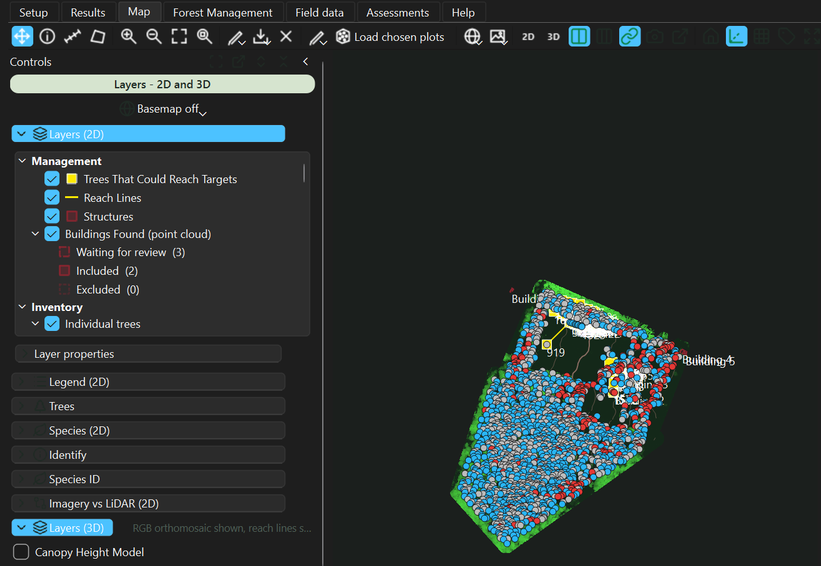
The software, as it looks on Windows.
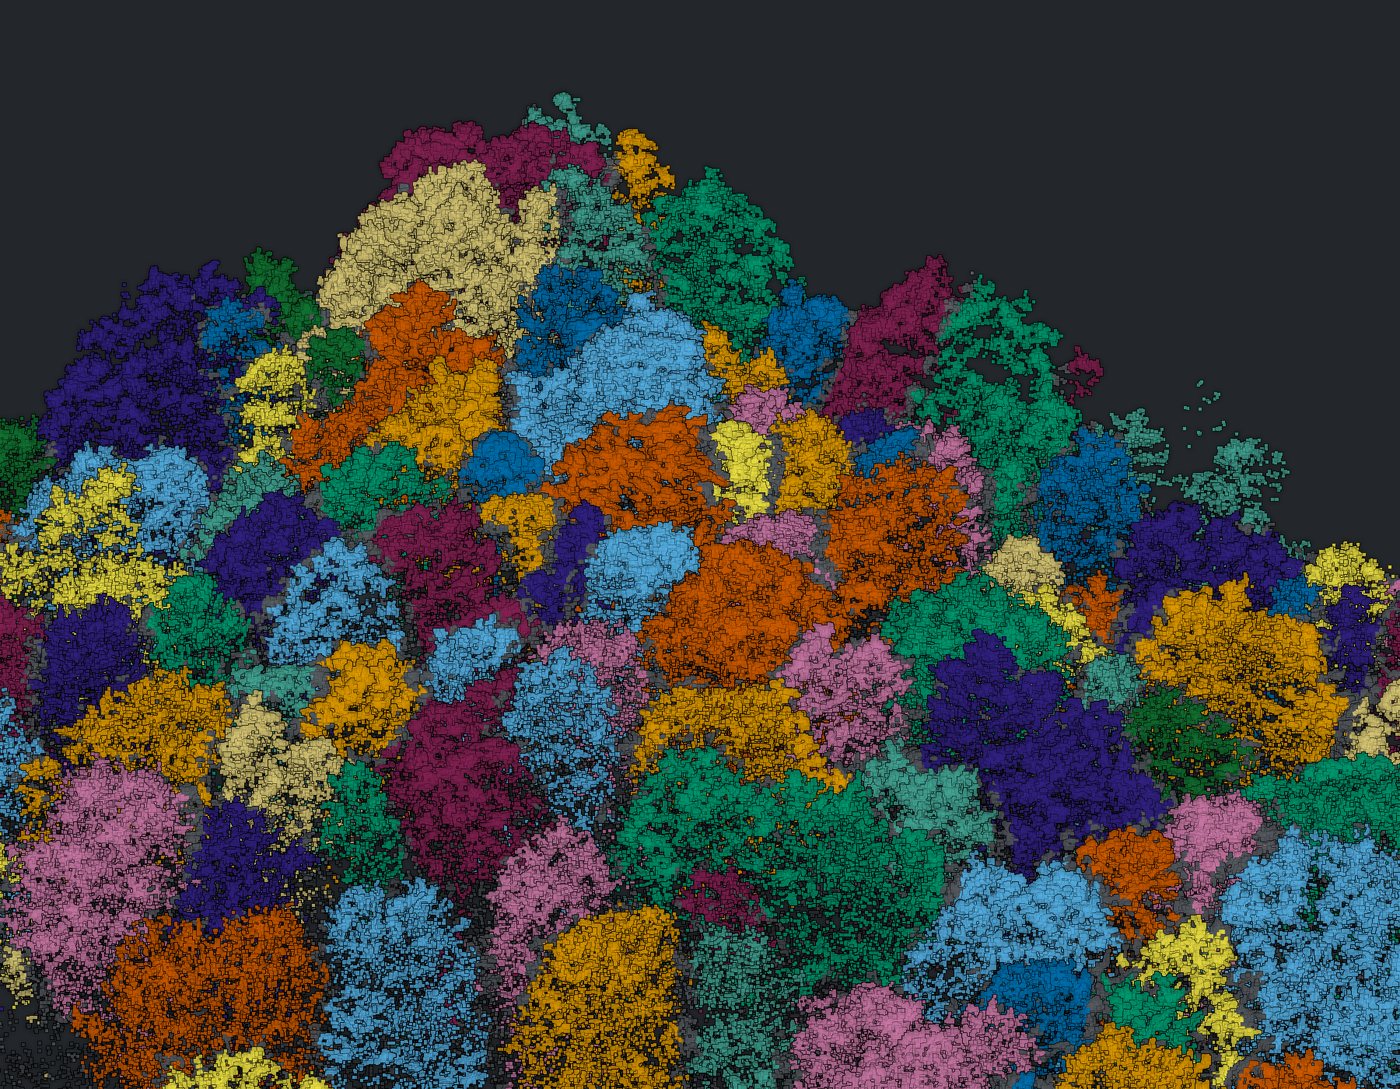
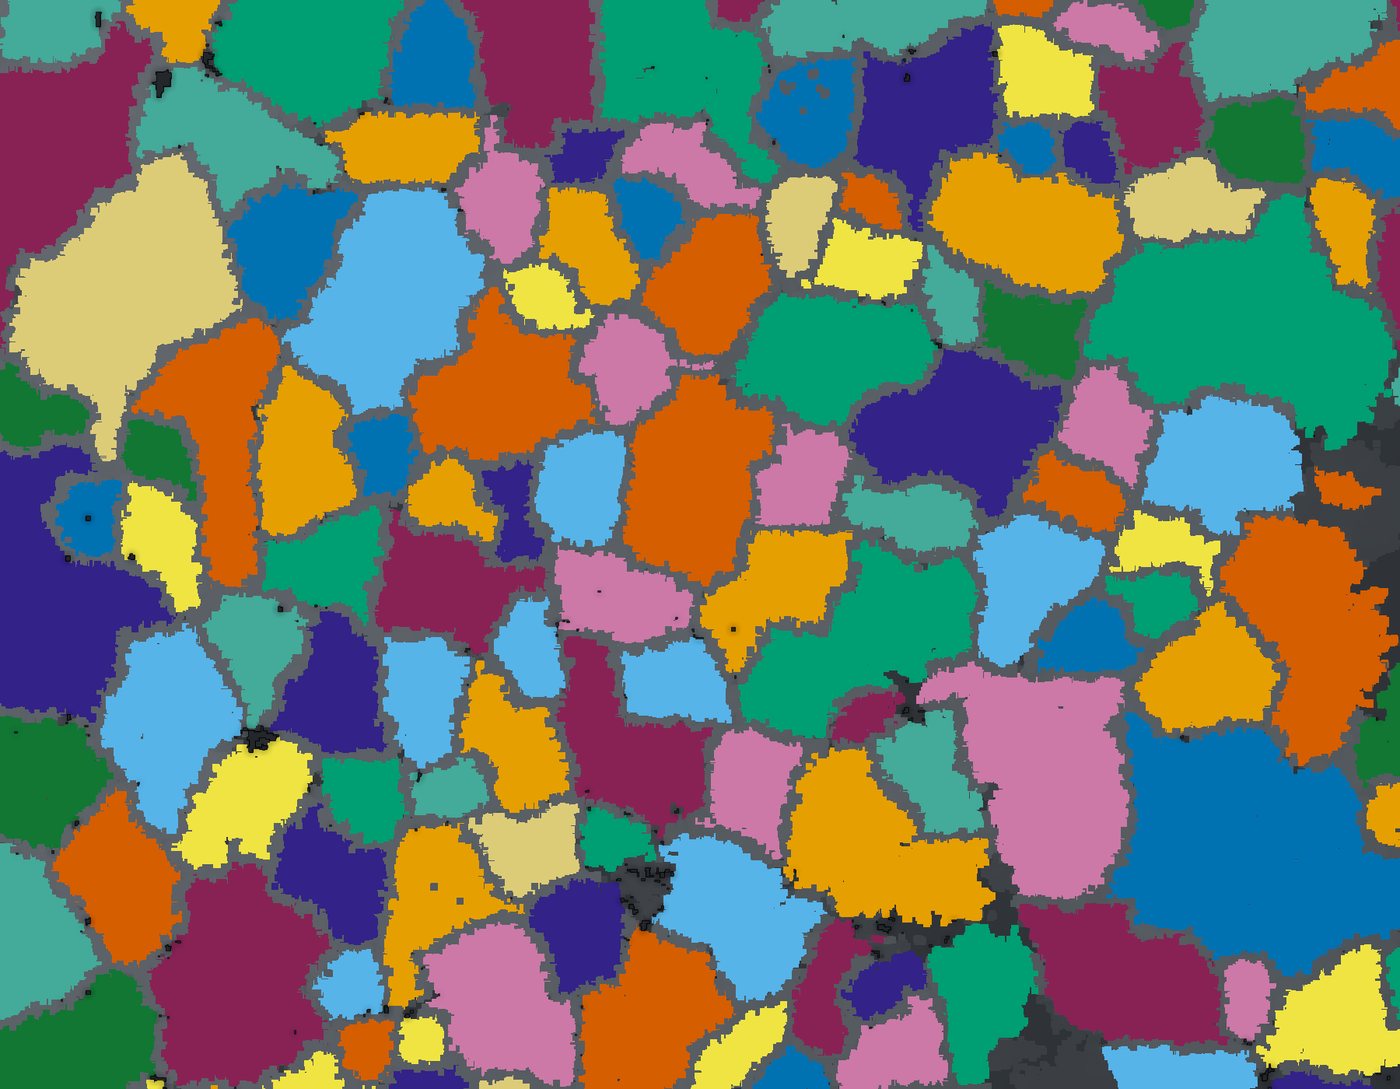
The 3D viewer streams large clouds with level of detail (COPC). The 2D map uses USGS basemaps, with Esri and OSM opt-in. Views split 2D/3D or pop out, tables are editable, and you can select by species with everything else faded. It also includes a Gaussian-splat viewer and point-cloud color modes.
FAQ
Questions.
What data does the software take, and do I need my own drone?
A drone LiDAR point cloud (LAS, LAZ or COPC) and five-band multispectral imagery (MicaSense) of the tract.
You do not need your own drone. We can fly the tract and deliver the inventory. If you already collect that data, the desktop app runs on your files.
When should the tract be flown?
Fly leaf-on if species matters: the species estimate uses the five imagery bands plus 16 LiDAR structure features. Say in your request when you need the flight.
How large a tract can it handle?
No acreage limit is published. The limit we can state today is memory, counted in points rather than acres: tracts over about 100 million points need a large-memory workstation, and a 172 million-point tract needs about 32 GB. The 3D viewer streams large clouds with level of detail.
Benton Hollow, at 28.3 acres, was one flight. Send your acreage with your request.
How long does a survey take, and what does it cost?
We have not published a delivery time or a price. Processing is the short part: Benton Hollow (28.3 acres) ran in 182 seconds on a laptop after the flight.
Surveys are quoted by acreage and access, and software access starts with a trial or demo request. Hosted processing with a web viewer is in development; today the Silvalytics app is Windows desktop software.
Is diameter measured or estimated?
Estimated. Height and crown diameter are measured from LiDAR; DBH, basal area and volume are model estimates. On one tallied plot at Benton Hollow the DBH RMSE fell from 9.3 in to 7.2 in after calibration, with bias moving from +4.7 in to -0.4 in.
How does field calibration work?
A guided wizard imports your plot tally (Emlid RTK exports are supported), matches field trees to crowns, refits the crown, DBH and species models, and re-runs the tract. Projects are organized as Project, Site, Plot, Run.
Diameter and volume are model estimates, and calibration is what ties them to your tract. On one tallied plot at Benton Hollow, held-out DBH RMSE fell from 9.3 in to 7.2 in and the crown-detection F-score rose from 0.36 to 0.73. Those are one tract's numbers. See the results table.
How reliable is the species call?
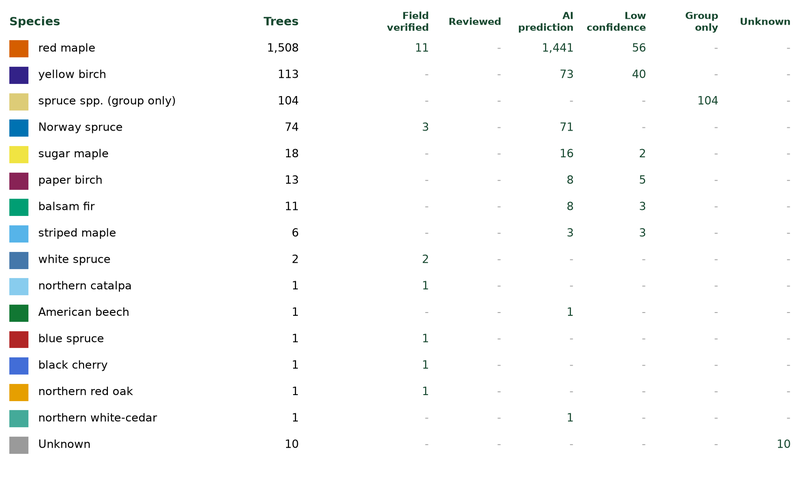
Species is experimental. Every call carries one of five statuses: field-verified, AI, low confidence, genus only (shown as “Group only” in the app table) or unknown. The table in the calibration section also has a Reviewed column.
In the Benton Hollow run, 20 trees were field-verified. On one plot there, the generic model got 0 of 24 held-out trees right. After calibrating on that tract it got 15 of 24 (62.5%), against 50% from always guessing the majority species.
Does this replace a cruise?
No. Grade and defect, understory and suppressed trees, direct DBH and species certainty still come from the cruise, and the cruise remains the accepted record in appraisal and legal work. The flight adds complete coverage, a position and height for every tree, speed, repeatability and a 3D record. See the full comparison.
Ready to fly a tract?
Tell us where it is and roughly how many acres.